|
GCSE level biology exam revision notes:
BIODIVERSITY Part 4.
Environmental checks, monitoring, analysis, data, biodiversity
and what can indicator species tell us about the environment, what is the influence of
abiotic factors?
[Author
©
Dr WP Brown PhD:
Doc Brown's biology exam revision notes suitable for students of UK
IGCSE & GCSE level biology courses & ~ US grades 9-10 biology,
page updated Feb 3rd 2026 *]
[Key
points and learning objectives for this page, after the main body of
notes]
Sub-index for biology notes on biodiversity
[email doc b]
*
[privacy-policies-disclaimer] *
]SEARCH doc b's
science website]
(4)
Biodiversity and what
indicator species can tell us (measuring abiotic factors too)
Introduction to
checks on the environment
The fact that certain organisms
are very sensitive to changes in their environment means they can be
used as indicators of pollution or other effects resulting from
human activity.
Organisms used in this way are
called indicator species and studying them can reveal much about
local ecosystems and the habitats and populations of specific plants
and animals.
Air pollution
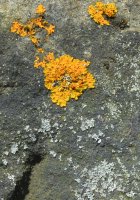 Lichen
are plant-like organisms that consist of a symbiotic
association of, usually green, algae or cyanobacteria and fungi.
Lichen are found worldwide in a variety of environmental conditions.
Species of crusty orange lichen and crusty grey lichen are shown in
the picture. They take on various physical forms e.g. bushy beards,
crusty spots, leafy pads and even small standing branches. Lichen
are plant-like organisms that consist of a symbiotic
association of, usually green, algae or cyanobacteria and fungi.
Lichen are found worldwide in a variety of environmental conditions.
Species of crusty orange lichen and crusty grey lichen are shown in
the picture. They take on various physical forms e.g. bushy beards,
crusty spots, leafy pads and even small standing branches.
Specific types of lichen are
very sensitive to the concentration of sulfur dioxide in
the atmosphere, SO2 is formed on burning fossil fuels
- particularly coal burning power stations.
The relative population
numbers of different types of lichen can indicate how clean
(unpolluted) the air is in that location.
If the air is not polluted
with acidic gases like sulfur dioxide, you will see lots of
lichen, particularly bushy lichen on e.g. stone walls,
rocks, roof tiles, tree bark. Bushy lichen is much more
sensitive to pollution than crusty lichen.
Fungi can also be used as
indicator species e.g.
Black spot is a fungal
disease that affects roses. It develops as black spots on
rose leaves, which eventually causes the leaves to turn yellow
and drop off. Apart from looking unsightly, it can seriously
weaken the rose plant.
The blackspot fungus on rose
leaves is very sensitive to sulfur dioxide. If sulfur dioxide is
present in the air, the blackspot fungus will not thrive. It
seems ironic that the presence of an unwanted and
unsightly blackspot fungus on rose leaves actually
indicates the presence of 'clean air'!
You might see how much lichen you
see on stone walls in a busy urban area with lots of pollution from
traffic, compared to a rural location well away from busy roads.
You should find more lichen,
the further you are away from busy roads, that is the further
away from sources of polluting acidic gases like nitrogen
dioxide and sulfur dioxide from road vehicle exhausts!
Water pollution
The most common sources of water
pollution are rain run-off washing nitrates from fertilisers
into streams and rivers (excess nutrients), and the discharge of raw sewage (which contains pathogens).
Both sources of pollution
facilitate the 'overgrowth' of particular microorganisms that
use up oxygen affecting many species in food chains - this reduces the concentration of oxygen in water.
Invertebrate animals like
freshwater shrimps and stonefly larvae are very sensitive to the
concentration of oxygen in their aquatic habitat.
If these two species are found in a stream or river it indicates a
relatively high
level of oxygen and a low level of pollutants, like
those mentioned above - in other words the water is 'clean'.
However, conversely, other
invertebrates have adapted to live in polluted water e.g. blood
worms (bloodworms) and sludge worms (sludgeworms) - what lovely
names! - would Linnaeus approve!
If these two indicator
species are present in water, it indicates a high level of
pollution.
Soil and woodland conditions
Moss, for example, can indicate
high levels of acidity in the soil, which in turn may indicate acid
rain. Fungi are useful for measuring health of old-growth
forests. The diversity of wood-decay eating fungi correlates to the
diversity of insects in a shared habitat.
Methods
of surveying-monitoring pollution - measuring abiotic factors
(This section is repeated in the
ecosystems notes)
Abiotic conditions means
the 'non-living' factors like temperature, water/soil pH,
soil nutrients, moisture level, light intensity, climate conditions
- again, all of these affect the distribution of organisms.
Measurement of abiotic factors
may help to explain differences in the populations and distributions
of organisms.
As described above, you can
survey and compare one location with another, looking particularly
for indicator species of plants or animals.
You might survey the length
of a stream or a stretch of a river, sampling-surveying at
regular intervals, looking at what species are present or not
present - relatively quick and easy to do.
This might help to trace the
source of pollution in a polluted stream or river.
However, surveys based on
'present/not-present' do not tell you how polluted the
specific environment is.
To get quantitative data
you would need to count the numbers of each indicator
species present in a measured area or volume of water - this set
of numerical data takes longer and more costly to do, but gives
a better estimate of pollution levels.
But, even doing species counts
does still not give you very accurate data on levels of pollution,
but using modern analytical instrumental methods. These
non-living indicators and allow rapid and regular checks to be
carried out to monitor pollution levels and see how they
change with time and location.
You can analyse air or water
samples for traces of polluting chemicals even if their
concentrations are only in ppm with electronic sampling devices.
You can monitor ozone,
carbon monoxide, nitrogen oxides and sulfur dioxide in the
polluted air of towns and cities with an air quality
meter.
You can analyse for
traces of toxic organic chemicals or heavy metal compounds
in water.
Electronic pH meters
tell how acidic or alkaline a water system is - choosing
different locations along a stretch of stream or river.
You can use a simple
visual indicator strip to measure the pH of soil.
It uses a sort of
universal indicator where match the colour strip turns in a
soil/water mixture and match the colour it turns to a pH
chart.
You can also dip the
electronic pH probe into a soil/water mixture - a more
accurate measurement.
Another electronic probe
instrument can directly measure the oxygen concentration
in water - just dip in and press the button! - again, choosing
different locations along a stretch of stream or river to
broaden the survey.
You can use an electronic
thermometer probe to measure the temperature of land or
water - again, choosing different locations along a transect to
broaden the survey.
You can employ a light
meter sensor to measure light intensity in different
locations e.g. comparing open and shaded areas of a habitat.
You can use a soil
moisture meter to measure the relative water content of
soil.
You can compare the
results of measuring abiotic factors with the distribution of
selected organisms to look for similarities or differences.
Key points -
Summary of
ideas
Based on
the syllabus-specifications for students taking the AQA, Edexcel and OCR
GCSE level biology examinations (~US grades 9-10).
Biodiversity
Biodiversity refers to the
variety of living organisms in an ecosystem, including species
diversity, genetic diversity, and ecosystem diversity. It is crucial for
maintaining ecological stability and resilience.
Environmental
Checks and Monitoring
Environmental checks
involve assessing the health of ecosystems by examining living and
non-living components.
Monitoring helps track changes over time,
allowing scientists to identify environmental issues, such as pollution
or habitat destruction.
Methods of Environmental
Monitoring:
-
Field Surveys
– Observing species presence and abundance.
-
Quadrats and
Transects – Sampling
methods for measuring species distribution.
-
Water Quality
Tests – Measuring pH,
oxygen levels, pollutants.
-
Air Quality
Tests – Monitoring
pollutants like sulfur dioxide and nitrogen oxides.
-
Soil Testing
– Measuring nutrient levels and contaminants.
Analysis & Data
Collection
Data collected during
environmental monitoring is analyzed to detect trends and determine
ecosystem health. Key processes include:
-
Statistical
Analysis – Identifying
patterns in species distribution and population changes.
-
Bioindicators
– Studying indicator species to assess environmental quality.
-
Comparative
Studies – Comparing
ecosystem changes over time.
Biodiversity
Indicator Species
Indicator species provide
insights into environmental health. Their presence, absence, or
abundance reflects changes in conditions.
Examples:
-
Lichens
– Sensitive to air pollution; a decline indicates high pollution
levels.
-
Mayflies
– Found in clean freshwater; their absence suggests water pollution.
-
Frogs &
Amphibians – Sensitive
to water quality due to their permeable skin.
-
Coral
– Indicates ocean temperature changes and acidity levels.
What Biodiversity
Indicator Species Tell Us
-
Declining
indicator species –
Suggests pollution, habitat loss, or climate change effects.
-
Increasing
populations –
Indicates improved environmental conditions or reduced pollution.
-
Species
migration – Can signal
climate changes affecting temperature and habitat suitability.
Influence of
Abiotic Factors
Abiotic factors are
non-living elements that influence ecosystems and biodiversity. Key
factors include:
-
Temperature
– Affects metabolic rates and species distribution.
-
Water
Availability –
Essential for organism survival, impacts species richness.
-
Light
Intensity – Influences
photosynthesis rates in plants.
-
Soil
Composition –
Determines plant growth and nutrient availability.
-
pH Levels
– Impacts aquatic and soil ecosystems.
-
Oxygen Levels
– Essential for respiration in aquatic species.
Exam Tips
-
Use real-life
examples of biodiversity indicator species in your answers.
-
Explain how
specific abiotic factors influence ecosystems.
-
Apply graphs
and statistics in data analysis questions.
-
Remember to link
biodiversity to ecosystem stability and sustainability.
Summary of
learning objectives and key words or phrases
Be able to describe how we can monitor environmental
conditions.
Use of pollution indicators e.g. the presence and
concentration of lichen, fungi, animal species, measuring oxygen
concentration in lakes and rivers, relative acidity of water (pH)
WHAT NEXT?
TOP OF PAGE
Sub-index for biology notes on biodiversity
INDEX of all my BIOLOGY NOTES
HOME PAGE of Doc Brown's Science
website
UK KS3 Science Quizzes for
KS3 science students aged ~11-14, ~US grades 6, 7 and 8
Biology * Chemistry
* Physics UK
GCSE level students aged ~14-16, ~US grades 9-10
Advanced Level Chemistry
for pre-university age ~16-18 ~US grades 11-12, K12 Honors
Find your GCSE/IGCSE
science course for more help links to all science revision notes
email doc
brown - comments - query?
Explaining the importance of
biodiversity & what indicator species can tell us
in GCSE level biology, What you need to know about biodiversity & what
indicator species can tell us for
GCSE level
biology,
Explaining the use of biodiversity & what indicator species can tell us knowledge in GCSE level biology, Examples of
biodiversity & what indicator species can tell us explained
when studying GCSE level biology, What is
the significance of biodiversity & what indicator species can tell us in GCSE level biology, describing and
explaining the theory of biodiversity & what indicator species can tell
us when studying GCSE level biology, revision
notes for biodiversity & what indicator species can tell us in exams, online help for understanding
biodiversity & what indicator species can tell us, exam revision
notes for biodiversity & what indicator species can tell us, what do I need to learn about
biodiversity & what indicator species can tell us? revision summary for
biodiversity & what indicator species can tell us, learning notes for
biodiversity & what indicator species can tell us, help to pass the
biodiversity & what indicator species can tell us
topic in an exam question, how to prepare for questions on biodiversity
& what indicator species can tell us in a GCSE
biology examination?
Based on the syllabus-specifications
for students taking the IGCSE/GCSE level biology examinations summary
revision notes and key points on biodiversity & what indicator species
can tell us for students taking the AQA
igcse/gcse biology notes on biodiversity & what indicator species can tell us, Edexcel gcse
biology notes on biodiversity & what indicator species can tell us, OCR 21st century GCSE
biology notes on biodiversity & what indicator species can tell us, OCR gateway
GCSE biology notes on biodiversity & what indicator species can tell
us, WJEC gcse biology notes on biodiversity & what indicator species can
tell us, CCEA
gcse biology notes on biodiversity & what indicator species can tell us for students taking CIE Cambridge igcse
biology, or any other GCSE or IGCSE level biology exams notes on
biodiversity & what indicator species can tell us, useful for US grade 9-10 biology courses,
Explaining the importance of methods of
monitoring pollution
in GCSE level biology, What you need to know about methods of monitoring
pollution for
GCSE level
biology,
Explaining the use of methods of monitoring pollution knowledge in GCSE level biology, Examples of
methods of monitoring pollution explained
when studying GCSE level biology, What is
the significance of methods of monitoring pollution in GCSE level biology, describing and
explaining the theory of methods of monitoring pollution when studying GCSE level biology, revision
notes for methods of monitoring pollution in exams, online help for understanding
methods of monitoring pollution, exam revision
notes for methods of monitoring pollution, what do I need to learn about
methods of monitoring pollution? revision summary for methods of
monitoring pollution, learning notes for methods of monitoring pollution, help to pass the
methods of monitoring pollution
topic in an exam question, how to prepare for questions on methods of
monitoring pollution in a GCSE
biology examination?
SITEMAP Website content © Dr
Phil Brown 2000+. All copyrights reserved on biology revision notes, images,
quizzes, worksheets etc. Copying of website material is NOT
permitted. Exam revision summaries and references to science course specifications
are unofficial.
|
